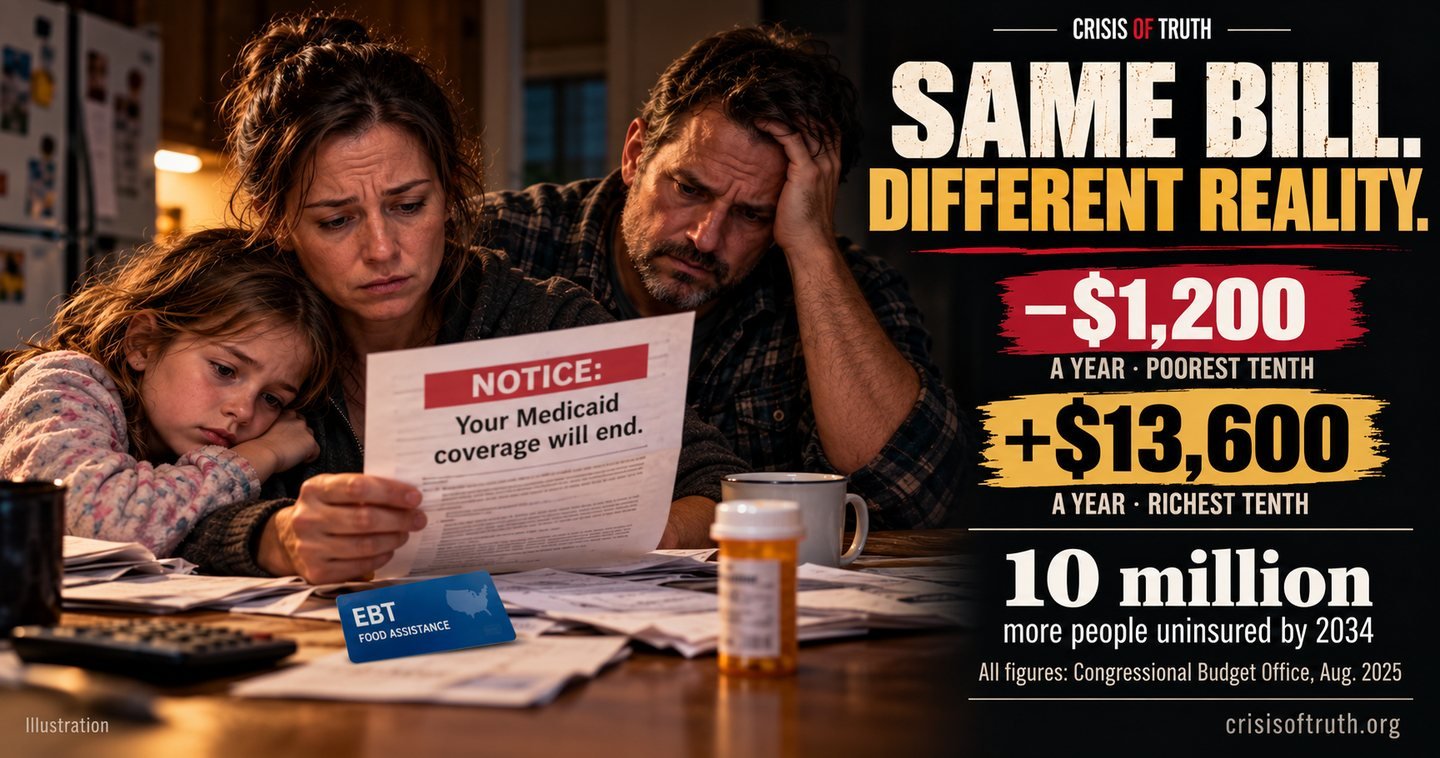
If your household is in the bottom tenth of American incomes, the law President Trump signed on July 4, 2025 will leave you with about $1,200 less every year through 2034. That's roughly three cents of every dollar you have. If your household is in the top tenth, you'll have about $13,600 more every year. Those aren't a critic's numbers or a campaign's numbers. They come from the Congressional Budget Office, the agency Congress created to keep score for both parties.1
The law's official name is Public Law 119-21. Most people know it as the "One Big Beautiful Bill." It did many things. This page covers one: who comes out ahead and who comes out behind.
The scorekeeper's invoice
The CBO took every tax cut and every spending cut in the law and asked where each dollar lands, household by household, from 2026 through 2034. Here is what it found, in 2025 dollars:
- Lowest tenth of households. Mainly from cuts to Medicaid and SNAP food aid. Equal to 3.1% of their income.1 −$1,200 a year
- Fifth tenth (the middle). Equal to 0.8% of income.1 +$800 a year
- Sixth tenth (the middle). Equal to 1.0% of income.1 +$1,200 a year
- Highest tenth of households. Mainly from lower taxes. Equal to 2.7% of their income.1 +$13,600 a year
Look at the direction, not just the size. As a share of income, the poorest households lose more than the richest households gain. And the middle does come out ahead — by less than a tenth of what the top gets.
Where the money comes from
The CBO sorted the law's effects into channels. Two of them explain almost everything on the invoice.
Tax changes add about $3.3 trillion to household resources over nine years, mostly by making the 2017 tax cuts permanent.1 Tax cuts are worth the most to people who pay the most tax, which is why the top tenth gains the most.
Health care and food aid subtract about $900 billion, "primarily because federal spending on benefits provided through Medicaid and SNAP will be lower," in the CBO's words.1 Those programs go almost entirely to low-income families, which is why the bottom tenth loses.
The health insurance numbers are the hardest to look at. The CBO estimates the law will leave 10 million more people uninsured in 2034 than before it passed.2 The single biggest driver is a new Medicaid work-reporting requirement.
The test already ran
Supporters say the work requirement targets able-bodied adults and moves people from benefits into jobs. That's a fair thing to want. It's also something we've already measured.
In June 2018, Arkansas became the first state to require Medicaid adults ages 30 to 49 to report 20 hours a week of work or related activity. By April 2019, when a federal judge halted it, about 18,000 people had lost coverage. Harvard researchers followed the state for two years and found the requirement did not increase employment. Among those who lost coverage, half reported serious problems paying medical debt, and more than half delayed care or medications because of cost.3
The researchers also found that more than 95 percent of the people targeted were already working or should have qualified for an exemption. Most people didn't lose coverage because they refused to work. They lost it because of the paperwork.3
The requirement didn't create jobs. It created paperwork, and the paperwork took the coverage.
The CBO expects coverage losses on a national scale. It estimates the Medicaid work requirement alone will leave an average of 4.5 million more people uninsured each year from 2027 through 2034. It also estimates the law's SNAP work rules will cut food-aid participation by about 2.4 million people in an average month.4
When it lands
- July 4, 2025 Law signed. Expanded SNAP food-aid work requirements take effect immediately.5 Now
- May 1, 2026 Nebraska becomes the first state to start the new Medicaid work requirement.6 Started
- Summer 2026 States must send notices to Medicaid members explaining the new rules.6 Started
- Dec. 31, 2026 Medicaid work requirement takes effect in every state, unless a state wins an extension for a "good faith effort." Extensions can run to the end of 2028.5,6 3 months
The honest reading
Strip away the slogans on both sides and the scorekeeper's finding is simple. The law moves money up the income ladder. It does that by cutting taxes that mostly the well-off pay, and by cutting health care and food aid that mostly the poor use.
You can believe that's good policy. Plenty of people do. But nobody can honestly say the bottom comes out ahead. The government's own analysis says it doesn't.
This is the same pattern documented in Something to Lose: when the ladder gets shorter at the bottom, the people standing on the lowest rungs pay first.