Evidence over outrage
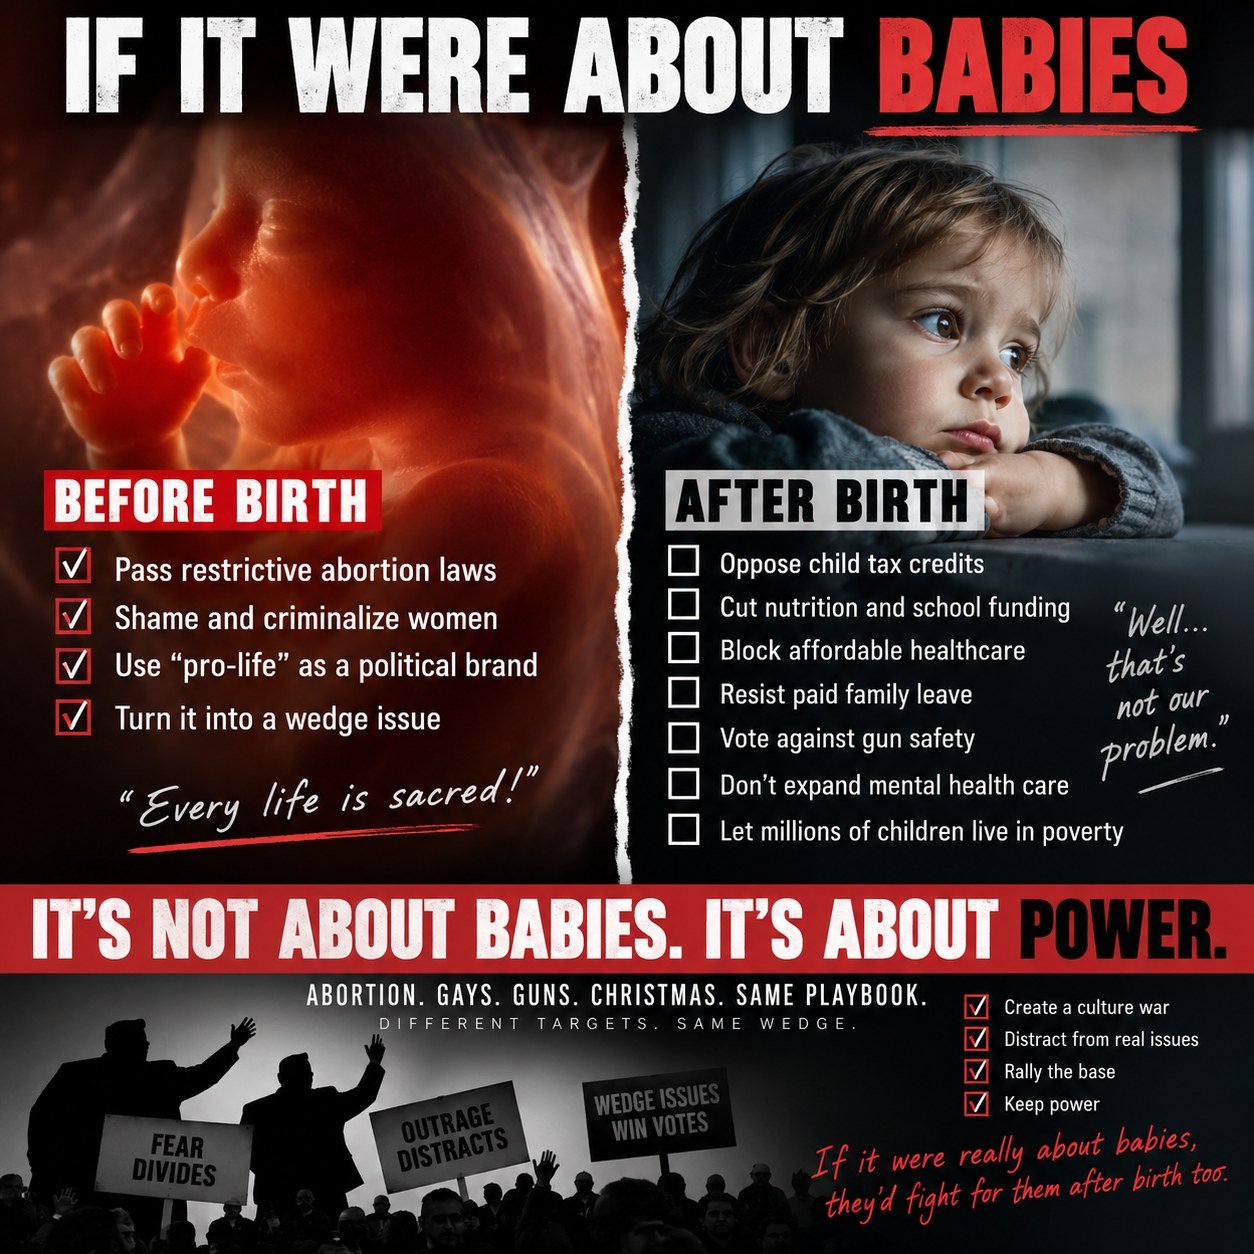
If it were about babies
A claim is made often enough that it is worth testing against documents: that restricting abortion is about protecting children. This page does not argue about motive. It puts the votes, the statute, and the federal measurements side by side.
Share of American children below the poverty line, Supplemental Poverty Measure, U.S. Census Bureau. The 2021 expanded Child Tax Credit was paid monthly through December of that year and then expired.
A 46% fall in one year.
Largest one-year rise on record.
How this page is built
Motive is unfalsifiable. An argument that cannot be falsified cannot be verified either, so this page does not make one. It reports what was voted on, what the statute says, and what the federal government measured.
Where the record cuts against the argument, that appears below in the same size type, under For the Record. Two of the five entries there weaken the case this page makes. They are printed anyway.
The claim
What is being tested
Restricting abortion is about protecting children. Those who support restrictions would defend a child after birth as readily as before.
This is sincerely held by tens of millions of people, and nothing here disputes the sincerity. The question is narrower and answerable: does the legislative record match it?
Finding 01
The experiment was already run
In 2021 the American Rescue Plan expanded the Child Tax Credit and paid it monthly. The Census Bureau's Supplemental Poverty Measure, which counts tax credits and non-cash benefits, recorded the result.
| Year | Rate | What happened |
|---|---|---|
| 2020 | 9.7% | Pandemic relief begins |
| 2021 | 5.2% | Expanded credit paid monthly |
| 2022 | 12.4% | Credit expired 31 Dec 2021 |
The 2021 figure was the lowest child poverty rate ever recorded and a 46% single-year decline. The 2022 rebound was the largest one-year increase on record: 5.2 million more children below the line.
This is not a projection or a model. It is the federal government measuring what happened when the money arrived, and what happened when it stopped.
The vote
The American Rescue Plan passed the Senate 50–49 and cleared the House 220–211 on final concurrence. No Republican voted for it in either chamber.
Finding 02
The current law raised the credit and left the floor alone
This is where the argument lives now, because it concerns what is on the books today rather than a credit that lapsed five years ago.
The One Big Beautiful Bill Act, signed in July 2025, raised the maximum Child Tax Credit from $2,000 to $2,200 per child and indexed it to inflation. It made no change to the three features that tie the credit to income: the $2,500 minimum earnings requirement, the 15-cent phase-in rate, and the $1,700 refundability cap.
Researchers at Columbia's Center on Poverty and Social Policy modelled what that combination produces.
| Children | Before | After |
|---|---|---|
| One | $33,000 | $36,500 |
| Two | $36,000 | $41,500 |
| Three | $39,000 | $46,500 |
| Four | $45,500 | $51,500 |
A family with two children now needs $5,500 more income than before to reach a credit that went up by $400. Families earning under $36,000 see no increase at all, because the refundable portion is calculated exactly as it was.
Seventeen million of them were already outside the full credit and gain nothing. Roughly two million more fell outside it because the threshold moved.
| Group | Share |
|---|---|
| Children of single mothers | 60% |
| American Indian / Alaska Native | 48% |
| Black children | 45% |
| Latino children | 39% |
| Children in rural areas | 35% |
| Children under six | 30% |
Where the shares are highest
The state with the largest share of children outside the full credit is Mississippi, at 41% — the state whose law ended Roe. Louisiana follows at 38%. Both have near-total abortion bans. Both decline Medicaid expansion.
Finding 03
Money already appropriated, refused
Ten states have still not adopted the Affordable Care Act's Medicaid expansion, which the federal government funds at roughly 90%: Alabama, Florida, Georgia, Kansas, Mississippi, South Carolina, Tennessee, Texas, Wisconsin and Wyoming.
About 1.4 million adults sit in the resulting coverage gap. Uninsured rates in non-expansion states run nearly double those in expansion states — 14.5% against 8.0%.
This carries more weight than an ordinary spending vote, because it is not a dispute about the size of government. The money is already appropriated. Declining it leaves federal dollars unspent.
Finding 04
Two federal counts, two different answers
Federal homelessness data is not one number, and the gap between the two instruments is itself evidence.
The Department of Housing and Urban Development runs a point-in-time count: people in shelters, in transitional housing, or visible on the street during a single night in late January. It does not reach families doubled up with relatives, living in motels, or sleeping in cars away from a street-count route.
The Department of Education uses the McKinney-Vento definition — lacking a fixed, regular and adequate nighttime residence — collected by school districts across a full school year.
| Count | Figure | Direction |
|---|---|---|
| HUD, single night Jan 2025 | 745,652 | Down 3.4%, first fall since 2016 |
| Schools, 2023–24 year | 1,548,191 | Up 12.6%, highest on record |
Of the 1.5 million children and youth the schools identified, only 4.4% were unsheltered and 12.7% were in shelters. The remaining four in five were in motels or doubled up — the categories the point-in-time count is not built to capture. The Government Accountability Office concluded in 2020 that the count likely underestimates the true number.
The structure is familiar from unemployment statistics. The headline U-3 rate counts people actively searching for work and excludes those who have stopped looking; the Bureau of Labor Statistics publishes U-6 precisely because U-3 alone understates the picture. The school count is the closest equivalent for children.
What that does and does not establish
It does not establish that the point-in-time number rose. It fell, and a count with stable methods can measure direction well even while measuring level badly. What it establishes is this: the instrument that uses the broader statutory definition, and that finds doubled-up children, recorded its highest total in twenty years of collection.
Counterpoint
For the record
Five things that cut against this page. A page that hides them deserves to be dismissed.
-
The 2017 tax law doubled the Child Tax Credit, from $1,000 to $2,000 per child. The 2025 law made that permanent and raised it again to $2,200 with inflation indexing. These are real pro-family provisions passed by the coalition this page scrutinises, and pretending otherwise would be dishonest.
-
The 2021 extension died with a Democrat casting the decisive vote against it. The expiration was not a party-line execution. It was a governing majority failing to hold its own coalition together.
-
In January 2024 a bipartisan expansion passed the House 357–70, with 169 Republicans voting yes and 47 against. It then died in the Senate, where three Republicans supported it on the floor. Any version of this argument that requires the claim that Republicans do not care about children does not survive that House roll call, and should be dropped by anyone making it.
-
The map of children outside the full credit is not a partisan map. The congressional districts with the highest shares are overwhelmingly Democratic-represented — Texas 34th, New York 15th, Texas 29th, Michigan 13th, Mississippi 2nd. The measure tracks poverty, not party. Using it as a partisan scoreboard would misread the data.
-
Two of the ten non-expansion states have no coverage gap. Georgia and Wisconsin cover low-income adults to 100% of the federal poverty level through waivers rather than full expansion. The coverage-gap figure applies to the other eight.
The strongest reply
Steelman
Stated as its defenders would state it
Opposition to abortion rests on the belief that killing an innocent human being is categorically different from declining to fund a benefit. One is an act, the other an omission. A person can consistently hold that the state must prohibit the first while disputing the wisdom, the cost, or the federal role in the second. Pointing at tax credit votes does not answer the moral claim; it changes the subject.
Further: many of the same people fund crisis pregnancy centres, adoption services, and church food and diaper banks with their own money and time. Measuring commitment solely by federal appropriations measures one channel and calls it the whole.
This is a serious argument and it is not disposed of by a meme.
The reply is narrow. The act-and-omission distinction explains opposing new federal spending. It does not explain declining money already appropriated, as in Medicaid non-expansion. And it does not explain raising a credit's headline value while leaving untouched the refundability rules that keep 19 million children from receiving it. That is not declining to spend. That is spending in a way that routes past the poorest children.
Record
Sources
- Record Drop in Child Poverty. U.S. Census Bureau, September 2022. SPM child poverty 9.7% (2020) to 5.2% (2021).
- Poverty in the United States: 2022. U.S. Census Bureau, September 2023. SPM child poverty 12.4% (2022).
- What 2022 Child Poverty Rates Would Have Looked Like. Center on Poverty and Social Policy, Columbia University. Largest one-year increase on record.
- House Clerk Roll Call 72, 10 March 2021 (220–211); Senate Roll Call 110, 6 March 2021 (50–49). H.R. 1319, American Rescue Plan Act.
- Collyer, Yera, Curran, Harris and Wimer. Children Left Behind by the H.R.1 "One Big Beautiful Bill Act" Child Tax Credit. Poverty and Social Policy Brief Vol. 9 No. 9, Columbia University, 6 August 2025.
- H.R. 1, One Big Beautiful Bill Act, Public Law 119–21, July 2025. Credit raised to $2,200; refundability provisions unchanged.
- House Clerk roll call, H.R. 7024, 31 January 2024 (357–70). Tax Relief for American Families and Workers Act.
- Status of State Medicaid Expansion Decisions. KFF, 2026. Ten non-expansion states; coverage gap approximately 1.4 million.
- 2025 Annual Homelessness Assessment Report, Part 1. U.S. Department of Housing and Urban Development, May 2026.
- 2026 Fact Sheet: Educating Children and Youth Experiencing Homelessness. National Center for Homeless Education data, 2023–24 school year: 1,548,191 students.
Crisis of Truth accepts no advertising, donations, sponsorships or grants. Nobody paid for this page and nobody can pull it. Corrections to the address on the masthead; every correction is logged on the page it affects.